How a Java Program Runs
Every time you type java HelloWorld in a terminal, a fascinating chain of events fires off inside your machine. Understanding that chain transforms Java from a black box into a system you can reason about, optimize, and debug with confidence.
The Big Picture
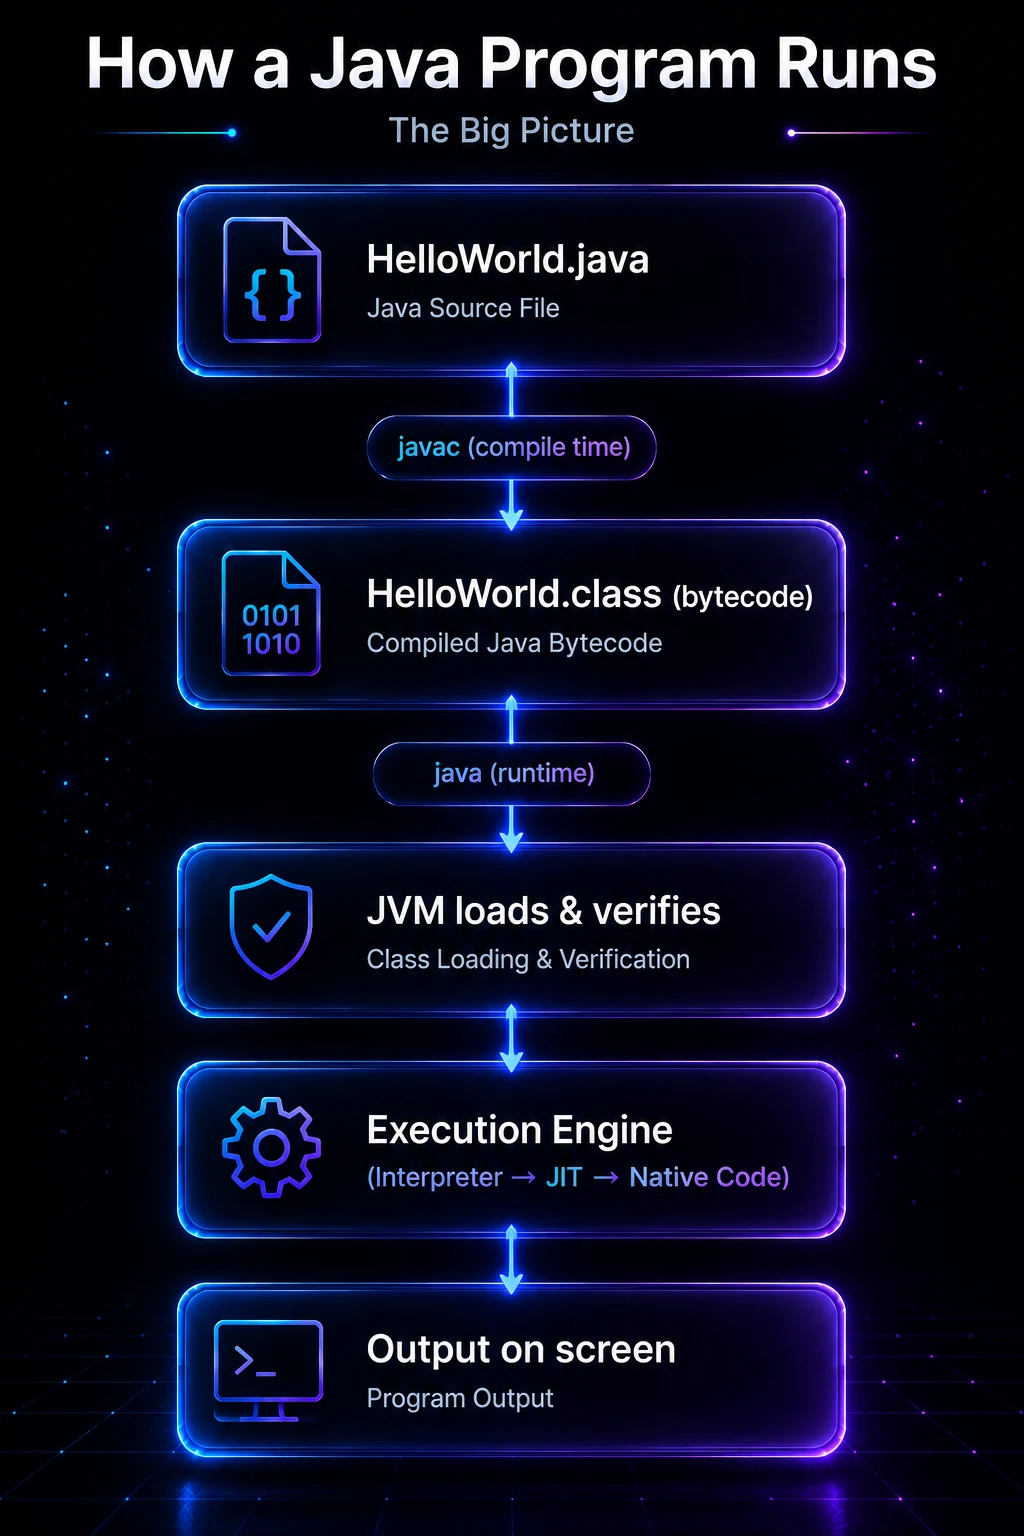
A Java program passes through three major phases before any output appears on your screen:
- Compilation —
javactranslates your human-readable.javasource file into platform-neutral bytecode stored in a.classfile. - Class Loading — the JVM finds, loads, and verifies the
.classfile at runtime. - Execution — the JVM’s execution engine runs the bytecode, with the JIT compiler progressively compiling hot paths to native machine code.
HelloWorld.java
      │
      ▼  javac (compile time)
HelloWorld.class  (bytecode)
      │
      ▼  java (runtime)
  JVM loads & verifies
      │
      ▼
  Execution Engine
  (Interpreter → JIT → Native Code)
      │
      ▼
  Output on screen
This separation between compile time and runtime is the reason Java is write once, run anywhere — the bytecode is the same on every platform; only the JVM implementation differs.
Step 1 — Writing and Compiling
You write source code in a plain-text .java file. The class name must match the filename exactly (Java is case-sensitive).
// File: Greeting.java
public class Greeting {
    public static void main(String[] args) {
        String name = args.length > 0 ? args[0] : "World";
        System.out.println("Hello, " + name + "!");
    }
}
Compile it with the javac tool that ships with the JDK:
javac Greeting.javaThis produces Greeting.class in the same directory. That file contains bytecode — a compact, stack-based instruction set designed for the JVM, not for any real CPU.
Tip: Use
javap -c Greetingto disassemble the bytecode and see the exact instructions the compiler generated. This is a great way to understand what high-level Java constructs actually translate to. See the javap Tool page for a full walkthrough.
Step 2 — Launching the JVM
When you run java Greeting, the java launcher:
- Starts a new JVM process.
- Initializes the runtime data areas (heap, stack, method area, etc.).
- Hands control to the Class Loader Subsystem to load
Greeting.class.
java GreetingOutput:
Hello, World!Pass an argument:
java Greeting JavaOutput:
Hello, Java!Note: The JRE (Java Runtime Environment) is the minimum you need to run programs. The JDK includes the JRE plus developer tools like
javac. Most production servers only install a JRE.
Step 3 — Class Loading
Before any method can execute, the JVM must load its class. The Class Loader Subsystem handles this in three phases:
| Phase | What happens |
|---|---|
| Loading | Finds the .class file (on disk, in a JAR, over the network) and reads its bytes into memory. |
| Linking | Verifies the bytecode is structurally valid; allocates static fields; replaces symbolic references with direct memory references. |
| Initialization | Runs the class’s static initializers and assigns initial values to static fields. |
Java uses a parent-delegation model: the Application class loader asks its parent (Extension/Platform loader), which asks its parent (Bootstrap loader), before attempting to load a class itself. This prevents user code from accidentally shadowing core JDK classes.
// You can inspect which loader loaded a class at runtime:
public class ClassLoaderDemo {
    public static void main(String[] args) {
        ClassLoader loader = ClassLoaderDemo.class.getClassLoader();
        System.out.println("Loaded by: " + loader);

        // Core JDK classes are loaded by the bootstrap loader (returns null)
        ClassLoader stringLoader = String.class.getClassLoader();
        System.out.println("String loaded by: " + stringLoader);
    }
}
Output:
Loaded by: jdk.internal.loader.ClassLoaders$AppClassLoader@...
String loaded by: null
null means the bootstrap class loader — a native-code loader that bootstraps the JVM itself. For a deep dive see Class Loaders & Class Loading.
Step 4 — Bytecode Execution
Once a class is loaded, the Execution Engine runs its bytecode. There are two mechanisms:
Interpretation
The JVM starts by interpreting bytecode — reading each instruction one at a time and executing the corresponding native operation. This is fast to start but slower than native code.
JIT Compilation
The HotSpot JVM profiles execution and identifies hot methods — code called frequently. The Just-In-Time (JIT) compiler then recompiles those methods to optimized native machine code, which runs at near-C speed.
public class JitDemo {
    public static long sumTo(long n) {
        long total = 0;
        for (long i = 1; i <= n; i++) {
            total += i;
        }
        return total;
    }

    public static void main(String[] args) {
        // Warm-up: JVM profiles these calls
        for (int i = 0; i < 100_000; i++) {
            sumTo(1_000);
        }
        // By now, sumTo() is likely JIT-compiled to native code
        System.out.println(sumTo(1_000_000_000L));
    }
}
Output:
500000000500000000Note: This is why Java programs sometimes feel slow at startup but run faster over time — the JIT needs real execution data to make good optimization decisions. This “warm-up” behavior is important to understand for latency-sensitive applications. See JIT Compilation & Bytecode for the full story.
Step 5 — Runtime Data Areas
The JVM carves memory into several distinct regions:
| Area | Per-thread? | Stores |
|---|---|---|
| Heap | No (shared) | All objects and arrays; managed by the Garbage Collector |
| Stack | Yes | Stack frames (local variables, operand stack, return address) for each method call |
| Method Area | No (shared) | Class metadata, static fields, constant pool |
| PC Register | Yes | Address of the current bytecode instruction |
| Native Method Stack | Yes | Frames for native (C/C++) methods called via JNI |
public class MemoryDemo {
    // Stored in the Method Area (class-level)
    static int counter = 0;

    // Objects are allocated on the Heap
    String label;

    public MemoryDemo(String label) {
        this.label = label;  // reference on stack, object on heap
        counter++;
    }

    public static void main(String[] args) {
        // Each call to main() gets its own stack frame
        MemoryDemo a = new MemoryDemo("alpha");
        MemoryDemo b = new MemoryDemo("beta");
        System.out.println("Created: " + counter);
    }
}
Output:
Created: 2Step 6 — Garbage Collection
You never free() memory in Java. When an object is no longer reachable from any live reference, the Garbage Collector (GC) reclaims its heap space automatically. The JVM’s GC runs concurrently with your application — modern collectors like G1 and ZGC (available in Java 21) achieve sub-millisecond pause times even on multi-gigabyte heaps.
public class GcDemo {
    public static void main(String[] args) {
        for (int i = 0; i < 1_000_000; i++) {
            // Each String "hello" + i becomes unreachable immediately
            String s = "hello" + i;
        }
        // No memory leak — GC collects unreachable String objects
        System.out.println("Done — no memory leaked.");
    }
}
Output:
Done — no memory leaked.For GC tuning and collector selection, see Garbage Collection Deep-Dive.
Under the Hood
What bytecode actually looks like
The javap -c disassembler reveals the stack-based bytecode the JVM actually interprets. Here is the bytecode for a trivial add method:
public class Math {
    public static int add(int a, int b) {
        return a + b;
    }
}
public static int add(int, int);
Code:
0: iload_0 // push local variable 0 (a) onto operand stack
1: iload_1 // push local variable 1 (b) onto operand stack
2: iadd // pop two ints, push their sum
3: ireturn // return top of stackEvery bytecode instruction is exactly one byte for its opcode (hence the name), followed by optional operands. The JVM is a stack machine — all arithmetic happens by pushing and popping values on the operand stack inside each stack frame.
HotSpot’s tiered compilation
Java 8+ uses tiered compilation with five levels:
- Level 0 — pure interpretation (cold start)
- Level 1–3 — C1 compiler (client compiler), progressively more optimized with profiling
- Level 4 — C2 compiler (server compiler), aggressive optimizations (inlining, loop unrolling, escape analysis)
The JVM automatically promotes methods between tiers based on invocation counts and back-edge counts (loop iterations). You can observe this with -XX:+PrintCompilation.
AOT and GraalVM native image
Java 21 + GraalVM Native Image can ahead-of-time (AOT) compile your entire application to a native binary, eliminating JVM startup time entirely. The trade-off is that runtime profiling-driven JIT optimizations are no longer available. This is increasingly popular for short-lived CLI tools and serverless functions where startup time matters more than peak throughput.
Putting It All Together
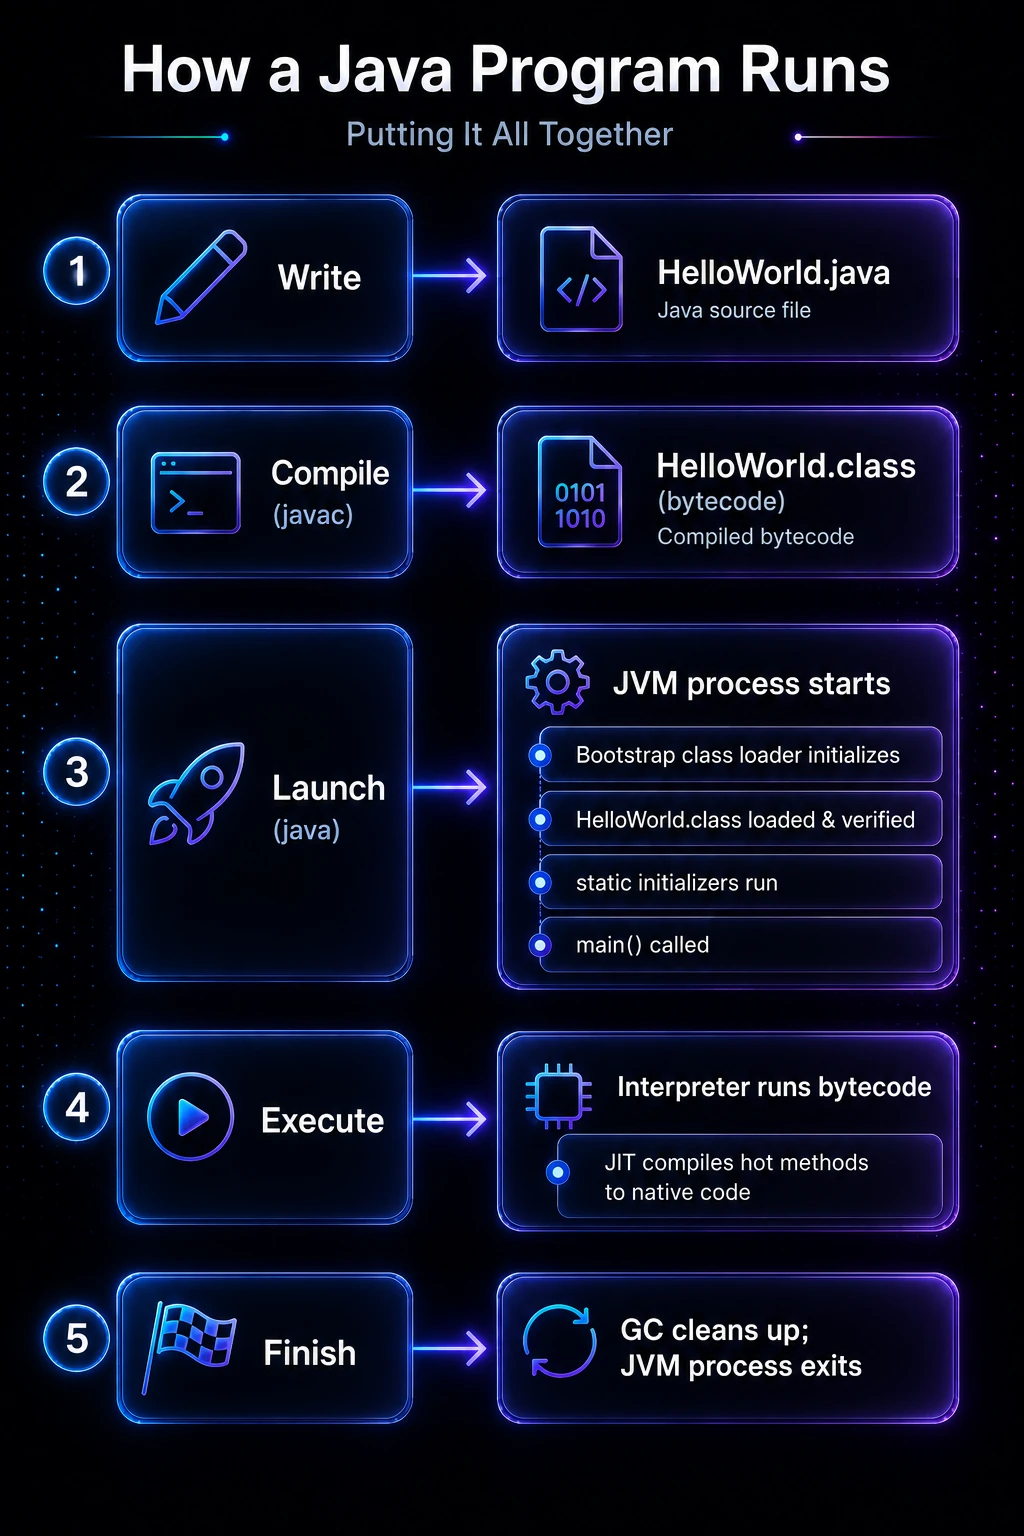
Here is the complete lifecycle in one view:
Write           →  HelloWorld.java
Compile (javac) →  HelloWorld.class (bytecode)
Launch (java)   →  JVM process starts
                   ├─ Bootstrap class loader initializes
                   ├─ HelloWorld.class loaded & verified
                   ├─ static initializers run
                   └─ main() called
Execute         →  Interpreter runs bytecode
                   └─ JIT compiles hot methods to native code
Finish          →  GC cleans up; JVM process exits
Every Hello World program you write goes through this exact pipeline. Knowing the pipeline makes error messages — ClassNotFoundException, StackOverflowError, OutOfMemoryError — immediately interpretable because you know exactly which phase produced them.
Related Topics
- JDK, JRE & JVM — Understand the three components that make up the Java platform before diving deeper into the JVM internals.
- JVM Architecture — A detailed look at the class loader subsystem, runtime data areas, and execution engine that power every Java program.
- JIT Compilation & Bytecode — How the HotSpot JIT profiler identifies hot methods and compiles them to native code for maximum performance.
- Class Loaders & Class Loading — The delegation model, bootstrap vs. application loaders, and how to write a custom class loader.
- Garbage Collection Deep-Dive — Generational GC theory, G1 and ZGC collectors, and how to tune memory for your application.
- Your First Java Program — If you haven’t written and run your first Java program yet, start here before exploring the internals.