JVM Architecture
The Java Virtual Machine (JVM) is the engine that makes Java’s “write once, run anywhere” promise real. Understanding its internal structure helps you write faster, more memory-efficient code — and gives you the vocabulary to diagnose performance issues when they arise.
The Big Picture
When you run a Java program, three things happen in sequence:
- The class loader subsystem finds, loads, links, and initializes your
.classfiles. - The runtime data areas (memory regions) store bytecode, objects, method frames, and more.
- The execution engine reads the bytecode and either interprets it or compiles it to native machine code.
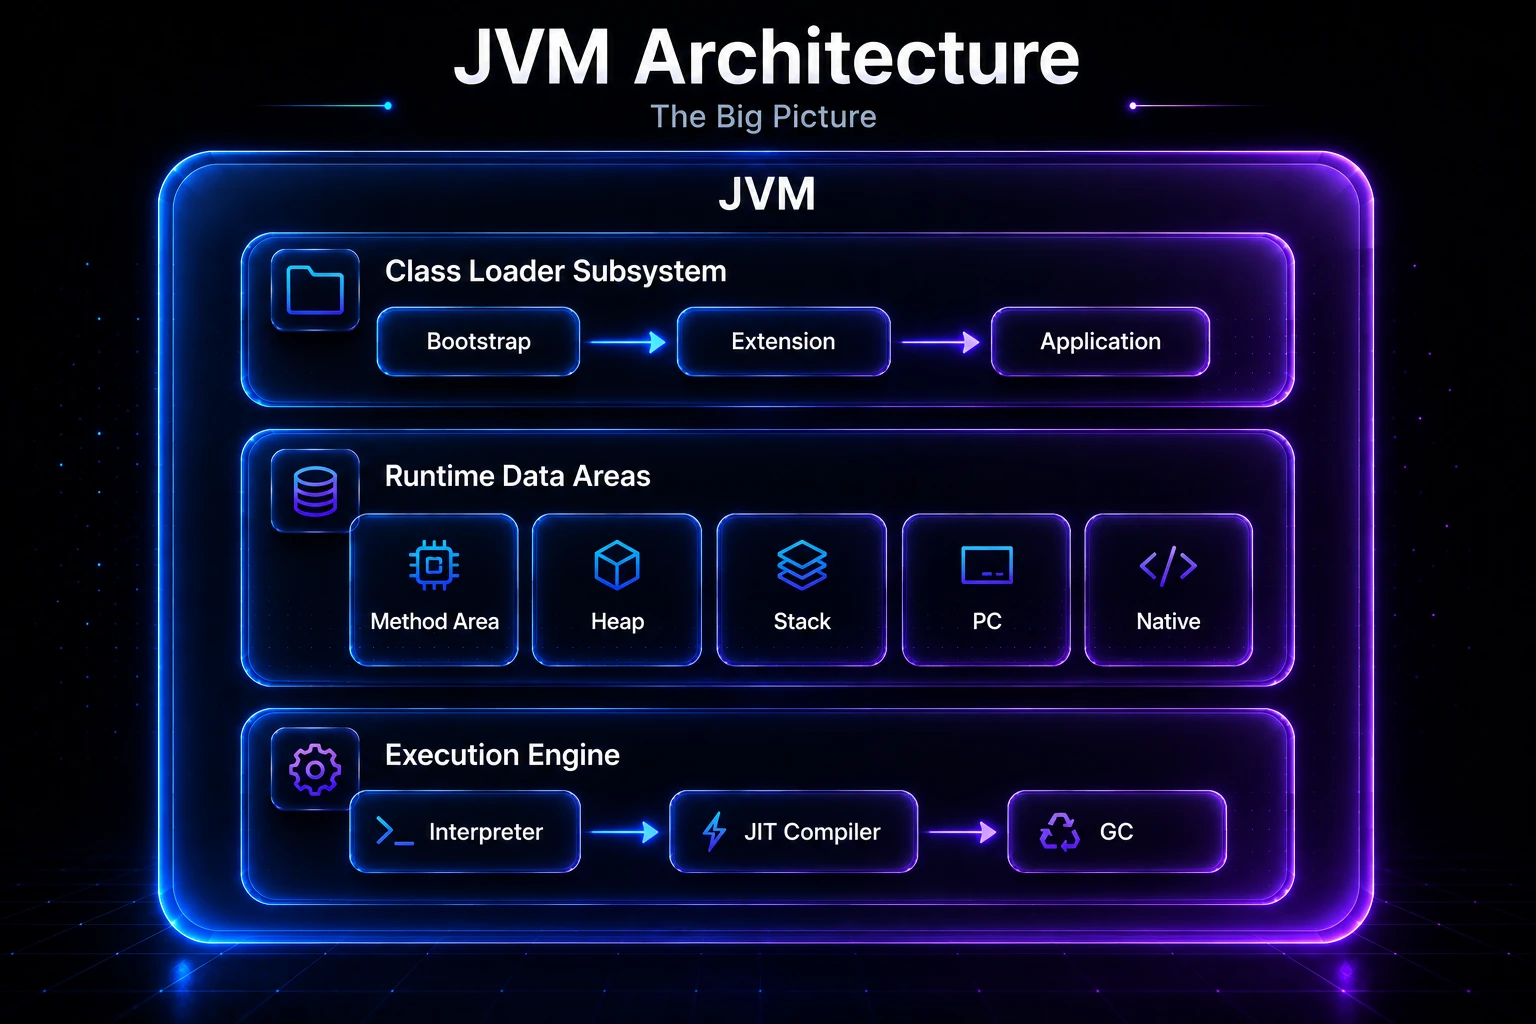
Here is a high-level map of those three pillars:
┌─────────────────────────────────────────────────────┐
│                    JVM                              │
│  ┌──────────────────────────────────────────────┐  │
│  │          Class Loader Subsystem              │  │
│  │  Bootstrap → Extension → Application        │  │
│  └──────────────────────────────────────────────┘  │
│  ┌──────────────────────────────────────────────┐  │
│  │          Runtime Data Areas                  │  │
│  │  Method Area │ Heap │ Stack │ PC │ Native    │  │
│  └──────────────────────────────────────────────┘  │
│  ┌──────────────────────────────────────────────┐  │
│  │          Execution Engine                    │  │
│  │  Interpreter │ JIT Compiler │ GC             │  │
│  └──────────────────────────────────────────────┘  │
└─────────────────────────────────────────────────────┘
Note: The JVM specification defines what each component must do; actual implementations (HotSpot, OpenJ9, GraalVM) may differ in how they do it.
Class Loader Subsystem
Before any bytecode runs, the class loader subsystem must find and prepare it. This happens in three phases: loading, linking, and initialization.
Loading
Java ships with three built-in class loaders, arranged in a parent-child hierarchy:
| Loader | Loads | Java API |
|---|---|---|
| Bootstrap | rt.jar / core JDK classes (java.lang.*, etc.) | built into JVM (native) |
| Extension / Platform | $JAVA_HOME/lib/ext or named modules (Java 9+) | sun.misc.Launcher$ExtClassLoader |
| Application | Your classpath / module path | sun.misc.Launcher$AppClassLoader |
The loaders follow the parent-delegation model: a child always asks its parent first. This prevents you from accidentally shadowing java.lang.String with your own version.
public class ClassLoaderDemo {
    public static void main(String[] args) {
        // Application class loader
        System.out.println(ClassLoaderDemo.class.getClassLoader());

        // String is loaded by the Bootstrap loader — returns null in HotSpot
        System.out.println(String.class.getClassLoader());
    }
}
Output:
jdk.internal.loader.ClassLoaders$AppClassLoader@...
null
See Class Loaders & Class Loading for a deeper dive into custom loaders and the delegation chain.
Linking
Linking has three sub-steps:
- Verification — checks that bytecode is well-formed and type-safe (prevents corrupt
.classfiles from crashing the JVM). - Preparation — allocates memory for class-level (
static) fields and sets them to default values (0,false,null). - Resolution — replaces symbolic references (e.g.,
"com/example/Foo") with direct references to actual memory locations.
Initialization
Static initializer blocks and static field assignments run here, in textual order.
public class Config {
    static int MAX_SIZE;

    static {
        MAX_SIZE = 100; // runs during initialization
        System.out.println("Config initialized");
    }
}
Runtime Data Areas
These are the JVM’s memory regions. Some are shared across all threads; others are private to each thread.
Method Area (Metaspace)
Stores class-level data: bytecode, constant pool, field and method metadata, and static variables. In Java 8+, this region moved from the old “PermGen” inside the JVM heap to Metaspace, which lives in native memory and can grow dynamically.
Note: You can still cap Metaspace with
-XX:MaxMetaspaceSize=256mto avoid unbounded native memory growth.
Heap
The heap is where all objects and arrays live. It is shared across threads and is the primary target of garbage collection. HotSpot divides it into:
- Young Generation — Eden + two Survivor spaces. Short-lived objects are allocated here.
- Old (Tenured) Generation — Objects that survive several GC cycles are promoted here.
// Every "new" keyword allocates on the heap
String message = new String("Hello, Heap!");
int[]  numbers = new int[1_000_000];
Tune heap size with -Xms (initial) and -Xmx (maximum). See Garbage Collection Deep-Dive for the full GC story.
Java Stack (Thread Stack)
Each thread gets its own stack, composed of stack frames. A new frame is pushed for every method call and popped when the method returns. Each frame holds:
- Local variable array — method parameters and local variables.
- Operand stack — a working area for bytecode instructions (push/pop values to compute results).
- Frame data — a reference back to the runtime constant pool for dynamic linking.
public class StackDemo {
    public static int add(int a, int b) {
        int result = a + b;   // stored in local variable array
        return result;        // frame is popped when this returns
    }

    public static void main(String[] args) {
        System.out.println(add(3, 4)); // a new frame is pushed for add()
    }
}
Output:
7Warning: Infinite recursion causes a
StackOverflowErrorbecause the stack has a fixed size (tunable with-Xss). JVM recursion must always have a base case.
Program Counter (PC) Register
Each thread has its own PC register that holds the address of the bytecode instruction it is currently executing. This is how the JVM knows where to resume after a method call.
Native Method Stack
When Java code calls a native (C/C++) method via JNI, a separate native method stack handles those frames. This is largely invisible to typical Java developers.
Execution Engine
The execution engine reads bytecode and converts it to something the CPU can actually run.
Interpreter
On startup, the JVM interprets bytecode — it reads each instruction, performs the corresponding action, and moves to the next. Interpretation is simple and fast to start, but slower at runtime than native code.
JIT Compiler
The JVM monitors which methods are called frequently (“hot spots”). Once a method crosses a call-count threshold, the Just-In-Time (JIT) compiler kicks in and compiles it to optimized native machine code. Future calls skip interpretation entirely.
HotSpot uses a tiered approach:
| Tier | Compiler | Purpose |
|---|---|---|
| 0 | Interpreter | First few invocations |
| 1–3 | C1 (Client) | Fast compile, basic optimizations |
| 4 | C2 (Server) | Aggressive optimizations for hot code |
Tip: Benchmarking Java code requires a “warm-up” phase so the JIT has time to compile. Libraries like JMH (Java Microbenchmark Harness) handle this for you automatically.
See JIT Compilation & Bytecode for a detailed look at inlining, escape analysis, and loop unrolling.
Garbage Collector
The GC runs inside the execution engine and automatically reclaims heap memory occupied by objects that are no longer reachable. Java 21 ships several collectors (G1, ZGC, Shenandoah, Serial, Parallel) with different trade-offs between throughput and pause time.
Under the Hood
How a Method Call Becomes Native Code
Consider this snippet:
public class Counter {
    private int count = 0;

    public void increment() {
        count++;
    }
}
When you compile this, javac produces bytecode for increment() roughly like:
aload_0          // push 'this' onto operand stack
getfield count   // push this.count
iconst_1         // push integer 1
iadd             // pop top two, push their sum
putfield count   // store result back into this.count
return
At first the interpreter executes each of those instructions one-by-one. After increment() is called enough times, C2 compiles the entire method to a native INC [mem] instruction — roughly 20× faster.
Object Layout in the Heap
Every Java object in HotSpot carries a 12-byte object header (on a 64-bit JVM with compressed oops):
- Mark word (8 bytes) — stores identity hash code, GC age, lock state.
- Class pointer (4 bytes) — points to the Metaspace entry for the class.
Then come the actual fields. Knowing this matters when you create millions of tiny objects: the header overhead adds up.
Thread Safety and the Memory Model
The heap is shared; the stack is private. That split is why un-synchronized access to a shared object from two threads can cause data races, while two threads manipulating their own local variables is always safe. The Java Memory Model defines the precise visibility guarantees.
Quick Reference
| Component | Shared? | Stores |
|---|---|---|
| Method Area / Metaspace | Yes (all threads) | Class metadata, static variables, bytecode |
| Heap | Yes (all threads) | Objects, arrays |
| Java Stack | No (per thread) | Stack frames (local vars, operand stack) |
| PC Register | No (per thread) | Current bytecode address |
| Native Method Stack | No (per thread) | Native (JNI) call frames |
| Execution Engine | N/A | Interpreter, JIT, GC |
Related Topics
- JDK, JRE & JVM — understand the three layers before diving into internals
- Class Loaders & Class Loading — how the JVM finds and prepares your classes
- JIT Compilation & Bytecode — how the JVM turns bytecode into blazing-fast native code
- Garbage Collection Deep-Dive — heap regions, GC algorithms, and tuning flags
- Java Memory Model — visibility, happens-before, and safe publication rules
- How a Java Program Runs — the end-to-end journey from source file to running process