JIT Compilation & Bytecode
When you run a Java program, your source code doesn’t go straight to the CPU — it passes through two compilation stages. Understanding those stages will help you write faster code, interpret profiler output, and feel confident that Java really can compete with C++ on raw speed.
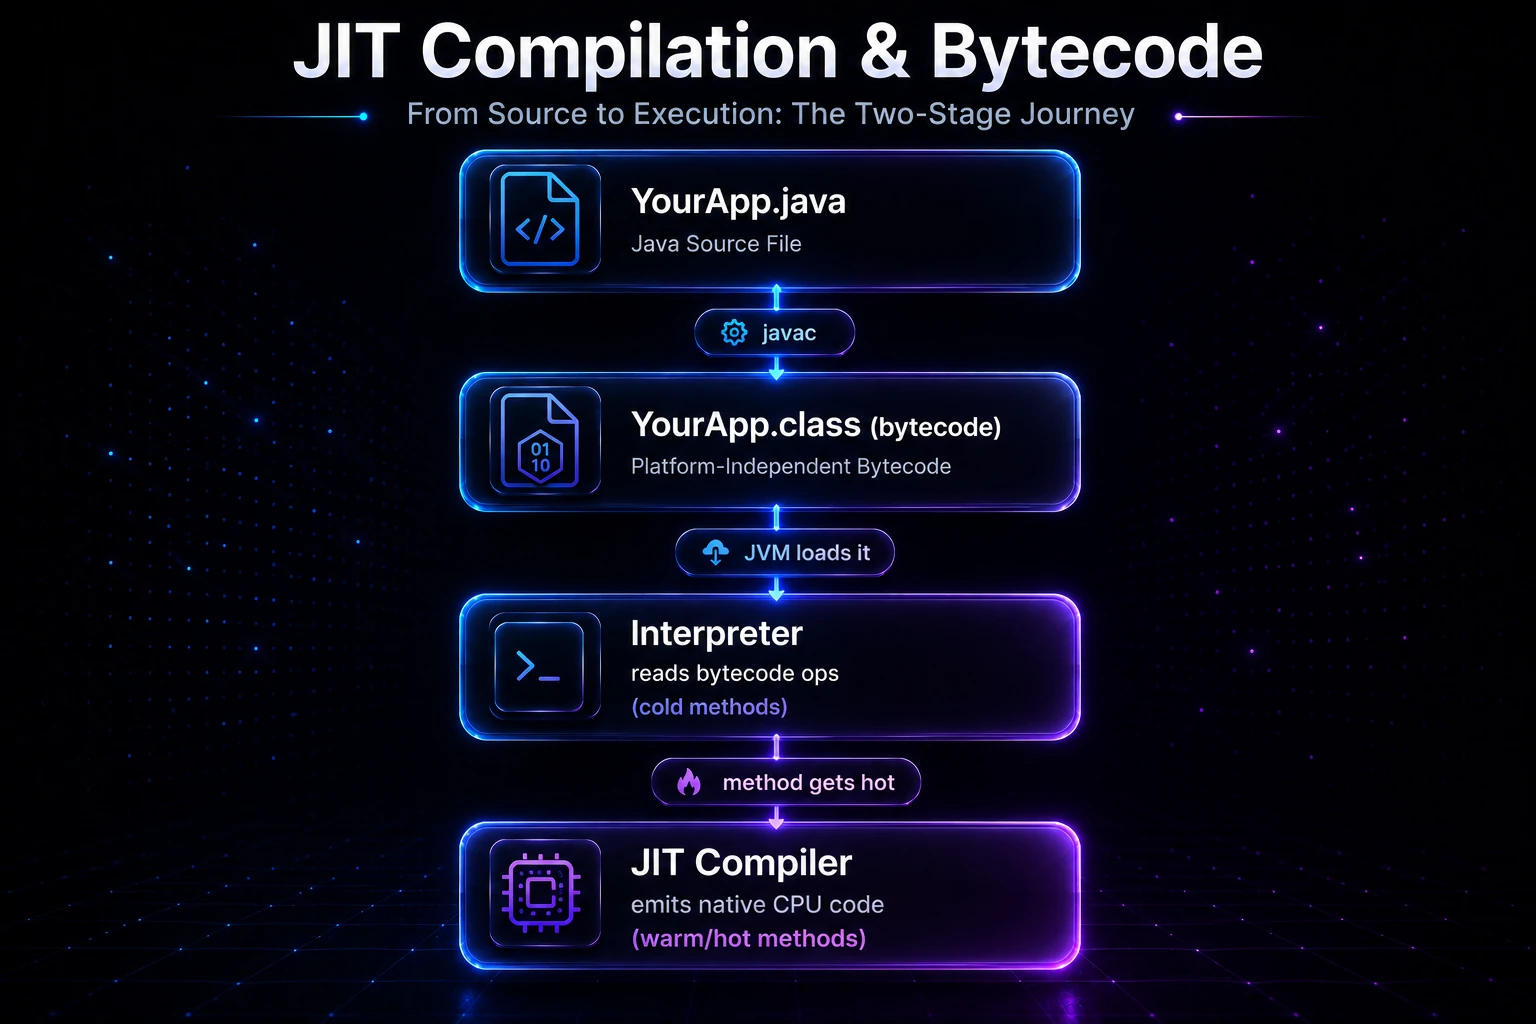
From Source to Execution: The Two-Stage Journey
Java’s portability comes from an elegant two-step process:
javac(ahead-of-time compile) — turns your.javasource into bytecode stored in.classfiles. Bytecode is a compact, platform-neutral instruction set understood by the JVM, not by any real CPU.- JIT compiler (runtime compile) — as the JVM runs your program, it profiles which methods are called frequently and compiles those “hot” methods to native machine code on the fly.
The result: your program is portable (bytecode runs on any JVM) and fast (hot paths execute as native instructions without interpretation overhead).
YourApp.java  ──javac──>  YourApp.class (bytecode)
                                  │
                            JVM loads it
                                  │
                    ┌─────────────▼─────────────┐
                    │        Interpreter         │  (cold methods)
                    │    (reads bytecode ops)    │
                    └─────────────┬─────────────┘
                                  │  method gets "hot"
                    ┌─────────────▼─────────────┐
                    │       JIT Compiler         │  (warm/hot methods)
                    │  (emits native CPU code)   │
                    └───────────────────────────┘
Note: The JVM specification only defines bytecode semantics. How JIT compilation works is an implementation detail. The examples here describe HotSpot, the JVM bundled with OpenJDK/Oracle JDK — which is what almost everyone uses.
What Is Bytecode?
Bytecode is a set of low-level instructions designed for a hypothetical stack-based virtual machine. Each instruction is one byte long (hence the name), optionally followed by operand bytes.
Compile and inspect this tiny class yourself with the javap disassembler:
public class Add {
    public static int add(int a, int b) {
        return a + b;
    }
}
Run javap -c Add and you get:
public static int add(int, int);
  Code:
     0: iload_0       // push local variable 0 (a) onto operand stack
     1: iload_1       // push local variable 1 (b) onto operand stack
     2: iadd          // pop two ints, push their sum
     3: ireturn       // return the top-of-stack int to caller
Four instructions. No heap allocation, no object overhead — just stack operations. See the javap Tool page for a full guide on reading bytecode output.
The Interpreter: Fast Startup, Slow Steady-State
When the JVM first loads a method, it interprets the bytecode: it reads each opcode, looks up what to do, and executes it. Interpretation is:
- Fast to start — no compilation delay.
- Slower at runtime — each bytecode instruction requires a JVM dispatch cycle, which adds overhead compared to native CPU instructions.
For code that runs only once or twice, the interpreter is fine. For code in a tight loop called millions of times, you want the JIT to take over.
The JIT Compiler: Turning Heat into Speed
HotSpot’s JIT is called HotSpot for a reason — it watches for “hot spots” in your code. When a method (or a loop back-edge inside a method) crosses an invocation threshold, the JIT compiles it to native code in a background thread and installs a “patch” so future calls skip interpretation entirely.
Tiered Compilation (Java 7+)
Modern HotSpot uses five tiers:
| Tier | Compiler | Typical Use |
|---|---|---|
| 0 | Interpreter | First invocations |
| 1 | C1 (no profiling) | Trivial or rarely called methods |
| 2 | C1 (limited profiling) | |
| 3 | C1 (full profiling) | Builds type/branch profiles |
| 4 | C2 (Server compiler) | Aggressively optimized native code |
Tier 3 (C1 with profiling) gathers statistics — which branch is taken 99% of the time, which interface has only one real implementation, which fields are always non-null. Tier 4 (C2) then uses those statistics to make bold, aggressive optimizations.
You can force a single tier for testing:
-XX:-TieredCompilation -client— C1 only (faster compile, slower peak)-XX:-TieredCompilation -server— C2 only (slow startup, maximum throughput)
For production, leave tiered compilation on (it is the default since Java 8).
Key JIT Optimizations
Method Inlining
The single biggest JIT win. If foo() calls bar() and bar() is small, the JIT copies bar()’s body directly into foo() — eliminating the method-call overhead and enabling further optimizations on the combined code.
public class Greeter {
    private static String greet(String name) {
        return "Hello, " + name + "!";
    }

    public static void main(String[] args) {
        // After warmup, the JIT inlines greet() here — no actual call frame
        System.out.println(greet("World"));
    }
}
Output:
Hello, World!Tip: Keep utility methods short (under ~35 bytecodes). The HotSpot inlining budget is tunable with
-XX:MaxInlineSizeand-XX:FreqInlineSize, but the defaults cover almost all real-world cases.
Escape Analysis & Stack Allocation
If the JIT can prove that an object never “escapes” the method that creates it (not stored in a field, not passed to another thread), it can allocate the object on the stack instead of the heap — zero GC pressure.
public class PointDemo {
    static double distance(double x, double y) {
        // Point never escapes this method — JIT may stack-allocate it
        record Point(double x, double y) {}
        Point p = new Point(x, y);
        return Math.sqrt(p.x() * p.x() + p.y() * p.y());
    }

    public static void main(String[] args) {
        System.out.printf("%.2f%n", distance(3.0, 4.0));
    }
}
Output:
5.00Loop Unrolling
Instead of checking the loop condition on every iteration, the JIT generates multiple copies of the loop body back-to-back, reducing branch overhead:
// Original bytecode equivalent:
for (int i = 0; i < 4; i++) sum += arr[i];

// After loop unrolling (conceptually):
sum += arr[0];
sum += arr[1];
sum += arr[2];
sum += arr[3];
Speculative (De-)Optimization
If a virtual method call always resolves to the same concrete type, the JIT can devirtualize it — treating it as a direct call and inlining it. If a new subtype is loaded later that breaks that assumption, the JIT deoptimizes (reverts to interpreted code) transparently.
This is why Java’s virtual dispatch can, in practice, be just as fast as C++‘s direct calls for monomorphic call sites.
Observing the JIT in Action
Warm-Up Effect
The JIT compiles in the background, so a method runs interpreted (slowly) until it is hot. This is called the warm-up period and is critical to understand when benchmarking:
public class WarmupDemo {
    static long sumUpTo(int n) {
        long total = 0;
        for (int i = 1; i <= n; i++) total += i;
        return total;
    }

    public static void main(String[] args) {
        // First few calls: interpreted (slower)
        for (int i = 0; i < 5; i++) {
            long start = System.nanoTime();
            long result = sumUpTo(1_000_000);
            long elapsed = System.nanoTime() - start;
            System.out.printf("Run %d: result=%d, time=%d ns%n", i + 1, result, elapsed);
        }
    }
}
Output (approximate — actual times vary by machine):
Run 1: result=500000500000, time=4821000 ns
Run 2: result=500000500000, time=3105000 ns
Run 3: result=500000500000, time=312000 ns
Run 4: result=500000500000, time=298000 ns
Run 5: result=500000500000, time=295000 ns
Notice runs 3–5 are ~16× faster once the JIT kicks in.
Warning: Never benchmark Java by timing only the first call. Use a proper micro-benchmark harness like JMH (Java Microbenchmark Harness) which handles warm-up, dead-code elimination, and statistical analysis automatically.
Printing JIT Decisions
You can ask HotSpot to log which methods it compiles:
java -XX:+PrintCompilation MyAppA typical line looks like:
127 34 3 java.lang.String::hashCode (55 bytes)The columns are: timestamp (ms), compile ID, tier (3 = C1 full profile), method name, and bytecode size.
Under the Hood
The Bytecode Instruction Set
The JVM has roughly 200 opcodes. They follow a naming pattern that encodes both the operation and the type:
| Prefix | Type |
|---|---|
i | int |
l | long |
f | float |
d | double |
a | reference (object/array) |
So iload, lload, fload, dload, aload all push a local variable onto the operand stack, but for different types. This explicitness allows the verifier to catch type mismatches at load time before a single instruction executes.
OSR: On-Stack Replacement
What if a method has a long-running loop rather than many short invocations? The JIT uses On-Stack Replacement (OSR): it compiles the loop body mid-execution, and at the next loop back-edge, it swaps the interpreted stack frame for a compiled frame — all without stopping the loop.
GraalVM & the JIT Future
GraalVM ships an alternative JIT (also called Graal) written entirely in Java. It can perform even more aggressive speculative optimizations and powers Native Image, which ahead-of-time compiles your entire application to a standalone executable — instant startup, no warm-up. Check the Modern Java (9–21) page for where this technology is heading.
Class Loading & JIT Interaction
The JIT deoptimizes compiled code when class loading changes its assumptions (e.g., a new subclass appears). This is why large frameworks that do heavy classloading at startup can show a warm-up “hump”. The Class Loaders & Class Loading page explains that lifecycle in detail.
Quick Reference
| Concept | What It Means |
|---|---|
| Bytecode | Platform-neutral .class instructions produced by javac |
| Interpreter | Executes bytecode directly; fast startup, moderate runtime speed |
| C1 compiler | Lightweight JIT; fast compilation, basic optimizations |
| C2 compiler | Aggressive JIT; slow compilation, maximum throughput |
| Tiered compilation | C1 first, then C2 for the hottest code |
| Inlining | Copying a callee’s body into the caller |
| Escape analysis | Proves objects don’t leave a method; enables stack allocation |
| OSR | Switching from interpreted to compiled code mid-loop |
| Deoptimization | Reverting compiled code to interpreter when assumptions break |
Related Topics
- JVM Architecture — the full picture of class loaders, memory areas, and the execution engine
- How a Java Program Runs — trace the journey from
.javasource file to running process - Class Loaders & Class Loading — how the JVM finds and initializes your classes, and how that interacts with JIT assumptions
- Garbage Collection Deep-Dive — escape analysis reduces GC pressure; understand the heap it’s saving
- javap Tool — disassemble
.classfiles and read real bytecode yourself - How Loops Work (Bytecode & JIT) — deep dive into loop unrolling, OSR, and branch prediction in real loop bytecode